The event calculator quantifies the relevant greenhouse gas emissions associated with your event and produces a carbon footprint for them. The calculated greenhouse gas emissions are based on current emission factors, scientific publications and international and internal statistics.
The aim is to provide users with a simple application, through which they can input a few details to specify the greenhouse gas emissions associated with their event and thus obtain a calculated result to raise awareness. They can also make a corresponding climate protection contribution for the emissions calculated, which is used to finance myclimate climate protection projects.
myclimate strives to give a full picture of the greenhouse gas emissions generated by events. In addition to mobility, overnight stays and meals, the current version of the event calculator offers the option of recording energy, purchased materials, goods and material transport and waste volumes.
General Information
The carbon footprint includes the relevant activities, materials and energy flows that are generated directly or indirectly during an event. The resulting greenhouse gas emissions generated from activities and the use of resources are calculated throughout their entire lifecycle.
The dataset used to calculate the climate balance comes from the ecoinvent 3.6 database and follows the IPCC 2013 (Intergovernmental Panel on Climate Change) evaluation method. This method uses greenhouse gas potential over a 100-year time horizon (GWP 100a).
The climate impact is generally indicated with the unit “kg CO2e”, i.e. “kilogram of CO2 equivalents”, which adds up the effects of all greenhouse gases. The most common greenhouse gas is carbon dioxide (CO2), which is produced when fossil fuels are burned, for instance. Besides CO2, other greenhouse gases such as methane (CH4) and nitrous oxide (N2O) are emitted during numerous processes.
System Boundary
myclimate aims to map the resulting greenhouse gas emissions as fully as possible. This includes all relevant activities and sources of resource consumption for an event. These comprise both emissions directly generated by activities as well as emissions caused by upstream and downstream processes, namely through raw material extraction, production and transport, as well as the use and disposal of resources. Direct emissions are those caused, for example, by the combustion of fuel in vehicles as well as by on-site fuel consumption for heating purposes. Indirect emissions may arise though the manufacture and rendering of products and services that are made use of for the event. An example of such a produc might be refreshments provided to event participants and employees. An example from the services category could be the journey to and from the event using public transport or the production of flyers and posters at a printing shop. Indirect emissions also include the electricity purchased and used in connection with the event.
Calculation Methodology
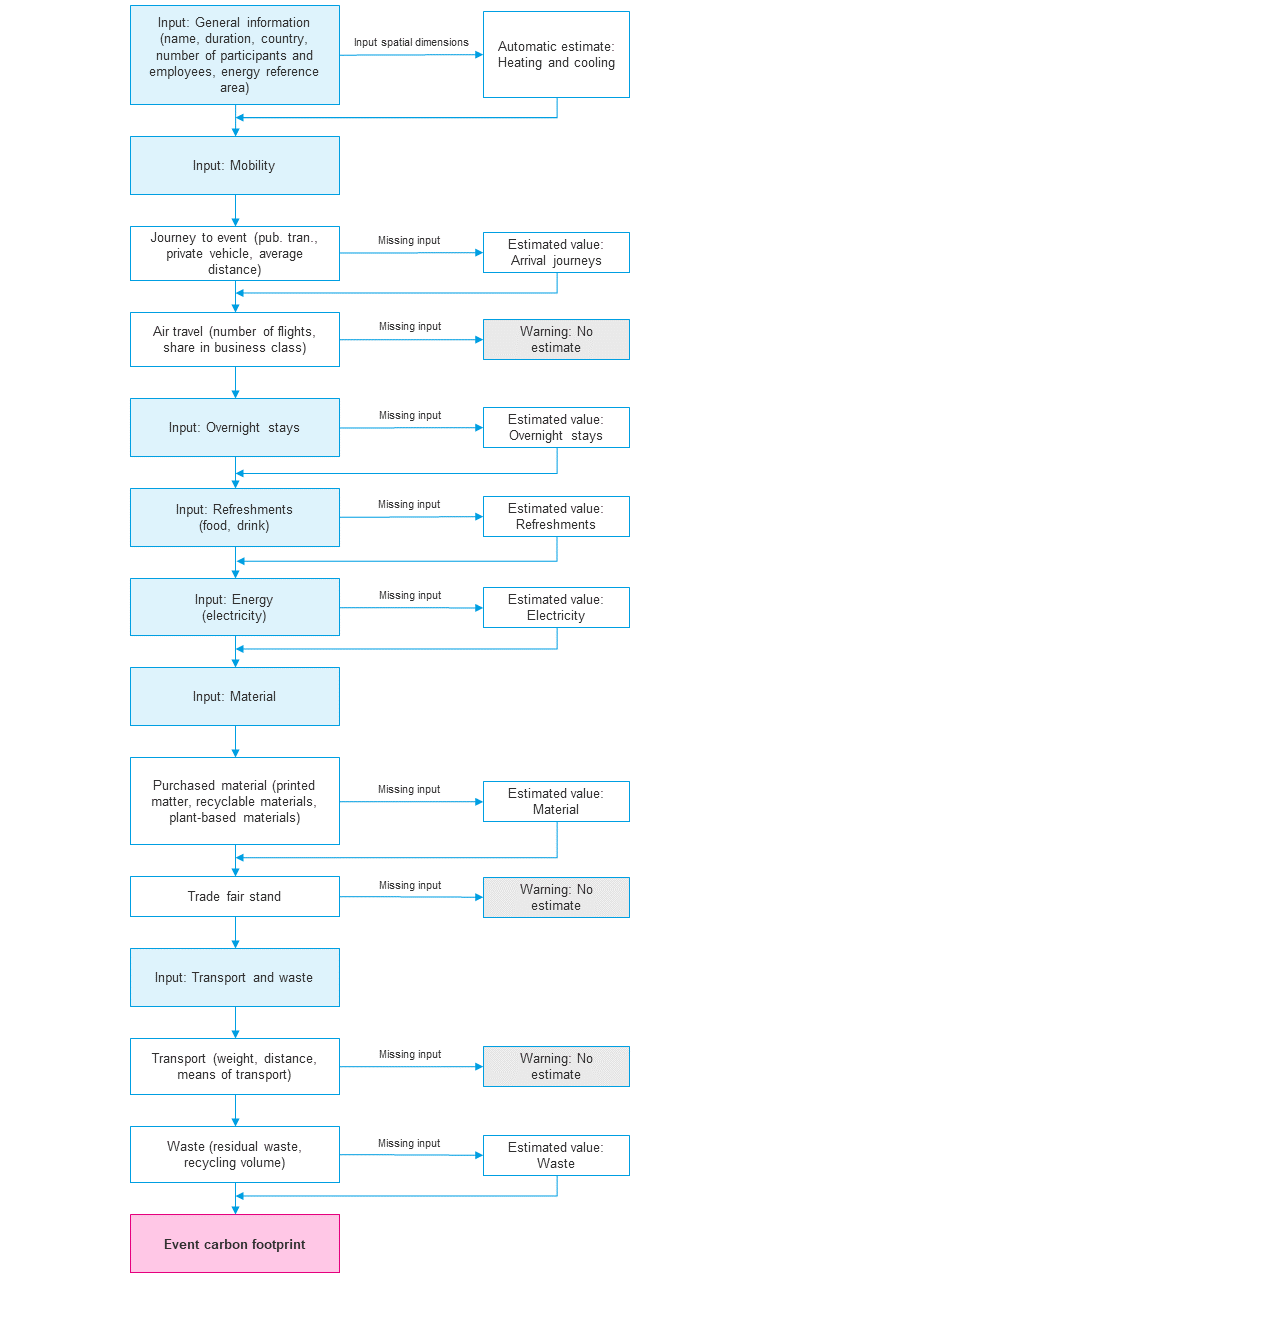
The information provided by users, such as activity and consumption data pertaining to mobility, overnight stays and meals, as well as energy, materials, transport of goods and materials and waste are combined with background data and then used to calculate the greenhouse gas emissions using current emission factors. The dataset used is ecoinvent 3.6, the world’s largest internationally recognised database for eco-inventories, as well as scientific publications, internal empirically established values and publicly available statistics. The geographical focus of the factors is Europe. If European factors are unavailable, globally valid factors are used as a rule.
For journeys to and from the event made by participants and employees via land, the user can input the number of people, as well as the average distance travelled per person for the journey using a private vehicle and public transport. If several people are travelling in the same vehicle (car sharing), only one person should be counted. The calculation logic doubles the distance in the background to automatically include the return journey. If there is no information available about the journey to the event via land, the emissions can be estimated using values established empirically by myclimate.
If participants or employees are arriving by plane, the total number of flights, in addition to how many of these are business class flights, can be recorded. The outward and return journey count as two trips and should be doubled accordingly. Since emissions from flights can be substantial and the use of air travel can vary greatly depending on the level of international attendance for the event, flights have been excluded from the estimate and as such should be separately recorded as accurately as possible.
When inputting data for hotel stays, the user can choose between the categories two to three stars, four stars and five stars. If there is no information available, the emissions for overnight stays can be calculated using values established empirically by myclimate.
Refreshments are roughly divided into food and drinks. Food is subdivided into the categories vegetarian, non-vegetarian and snacks. In the drinks category, mineral water, soft drinks, coffee, tea, beer, wine and spirits are recorded. The emissions generated by food and drink are calculated using corresponding emission factors. If there is no information available, the upstream emissions associated with refreshments can be estimated.
For the calculation of emissions from energy consumption at the event, power consumption is calculated on the basis of a country-specific production mix. In addition, the user can indicate whether certified green energy is used. If information on energy demand is unavailable, the emissions for the building energy can be estimated using values established empirically by myclimate and with the help of spatial dimensions (“General” tab). To this end, the sum of heated and cooled areas is used.
The calculation of the emissions from heating and cooling is performed automatically in each case using the corresponding spatial dimensions (“General” tab) and calculated using values established empirically by myclimate. The basis of this calculation is a mixture of heating oil, natural gas and wood energy.
In the materials category, printed matter (e.g. flyers or brochures for the event), plastic products, (e.g. cups, pens and other give-aways) recycled and recyclable materials (e.g. PET and glass) and plantbased materials (wood, cardboard, paper, etc.) are recorded. In addition, the upstream emissions from an event stand can also be calculated here using its spatial dimensions. The emissions are calculated in just the same way as for the other categories using input data and the corresponding emission factors. If no information on material consumption is available, the emissions can be estimated using values established empirically by myclimate. The event stand is excluded here as, depending on the event type, the intensity of its use may vary considerably.
The last category allows the user to record the transport of goods and materials and the waste generated. In order to calculate transport emissions, the volume of the transported material, the distance and the means of transport are recorded. If more than one transportation run takes place, the total transported weight and the average distance covered should be recorded. Transport of goods and materials is excluded from estimates and should be input separately, if relevant for the event.
Users can also record recycling volumes if applicable. The emissions are calculated in the same way as for the other categories using input data and the corresponding emission factors. An estimate of the emissions is also possible here.
Because statistical values and well-thought-out assumptions are sometimes used in individual calculations, an uncertainty margin of 20 per cent is added to the emissions result.
The user also has the option of calculating an overall estimate for the event. Only the profile data must be input for this estimate. Please be aware that such a general estimate may deviate substantially from the actual emissions of the event. The general estimate excludes air travel and the transport of goods and materials, since these values can vary substantially depending on the event. Both of these items can still be manually added to the general estimate using the corresponding tabs. All other items that require more detailed inputs will be overwritten with estimated values in the general estimate.
For an even more specific and detailed analysis of your event with an individually adapted data basis, please contact info@myclimate.org. myclimate will be happy to support you within the framework of a service order.