The flight emission calculator quantifies the direct and indirect CO2-equivalent emissions per passenger or for a group travelling together for a given flight distance (if required, with a stopover) between the origin and destination airports. The quantification is based on the latest international statistics and consists of a detailed selection of parameters and specifications on passenger load, cargo loads, cabin class and aircraft types including indirect emissions from aircraft operations.
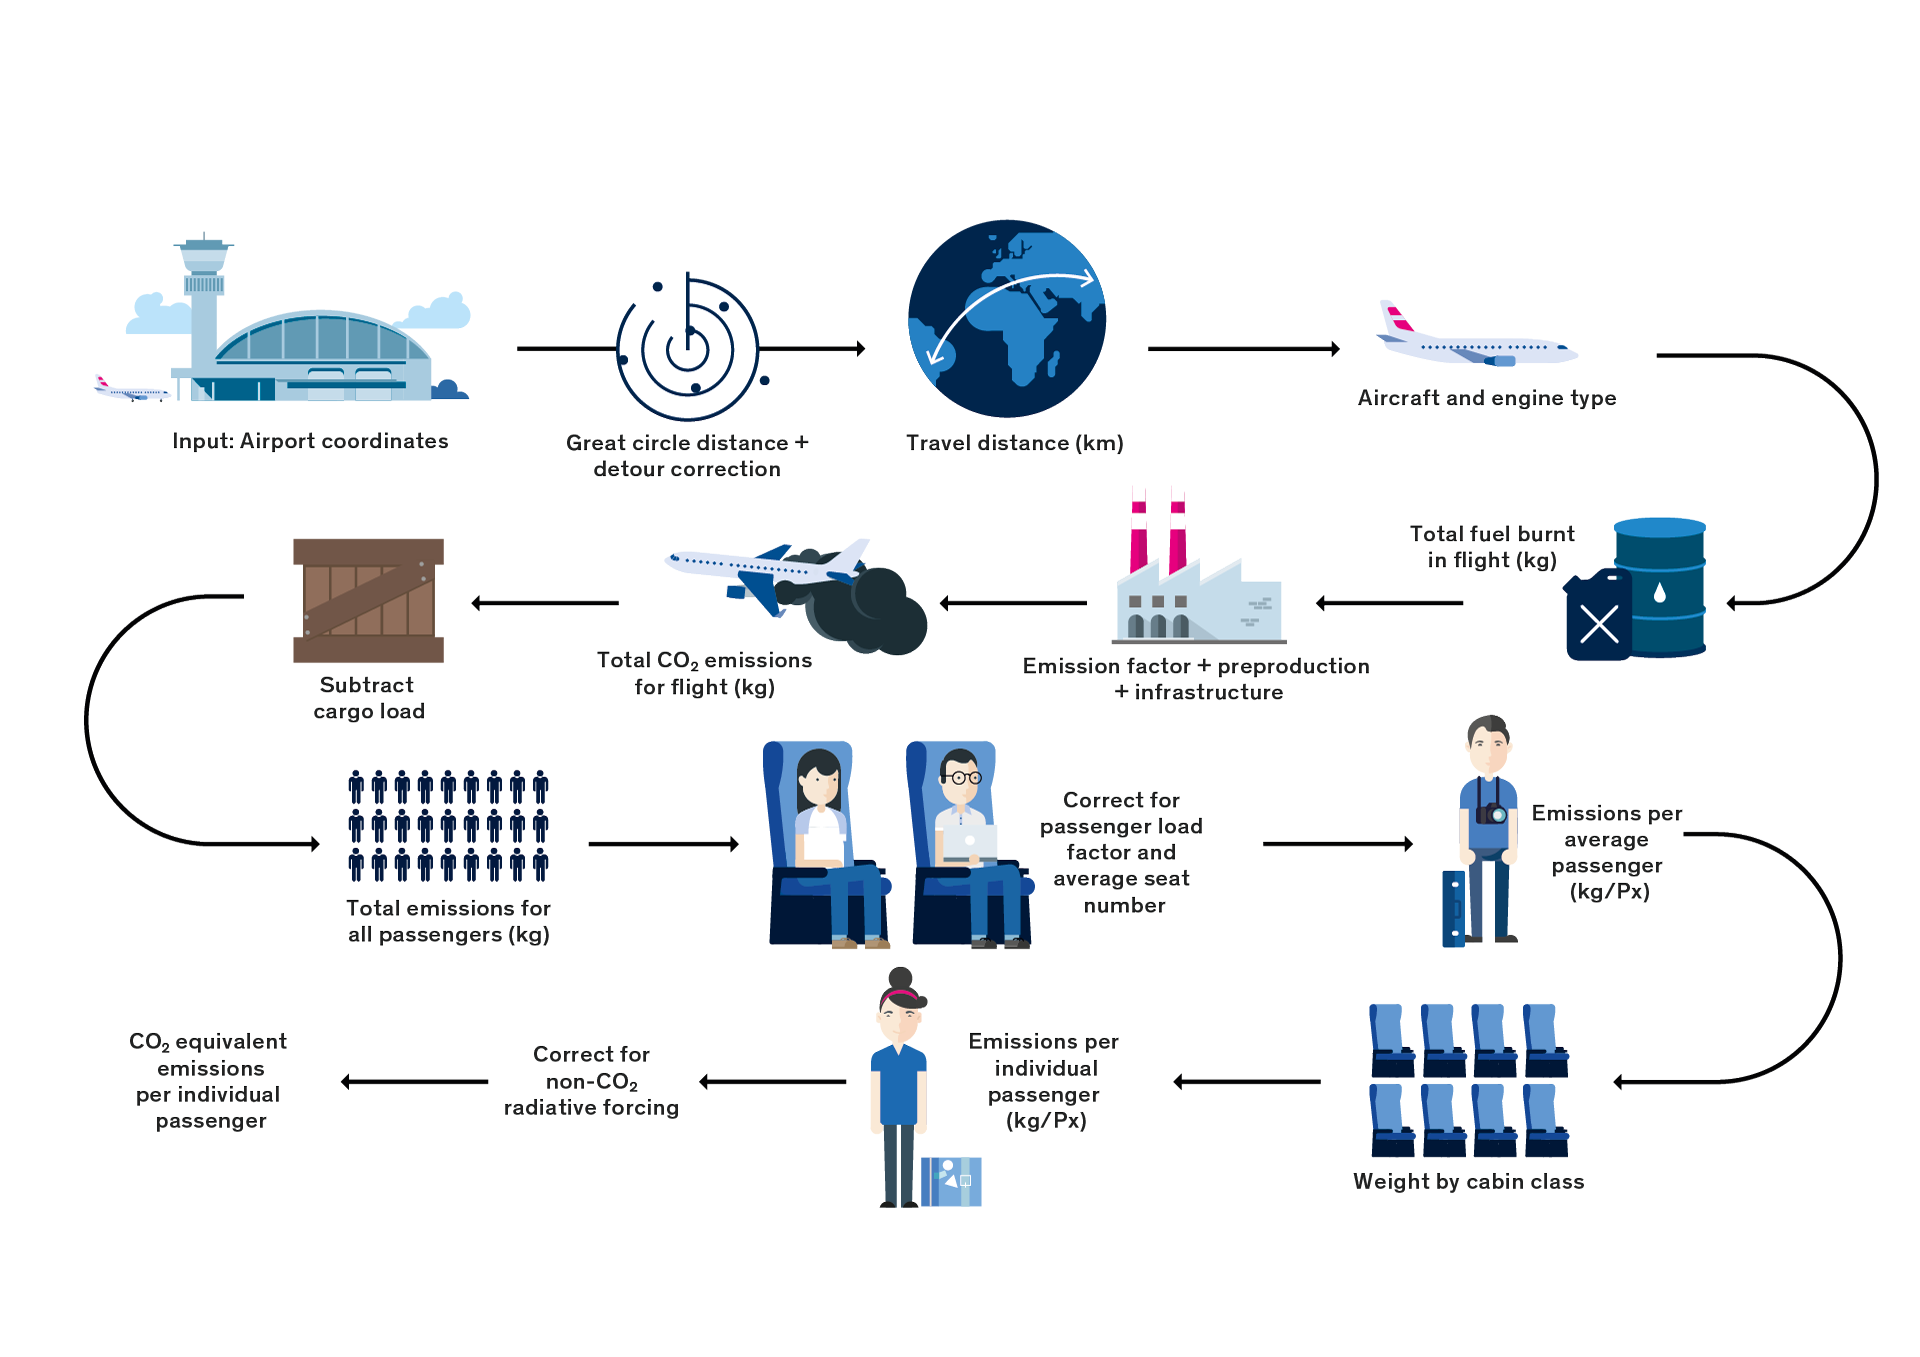
The process for calculating flight emissions is described in detail below, step by step. The factors used are all based on information in literature and on current statistics. Wherever possible, emission calculations and assumptions are in line with the European standard DIN EN 16258. Due to constantly changing processes and efficiency improvements in the aviation industry, the data used for the flight emission calculator is reviewed and updated regularly. The amount of CO2 equivalents per passenger or per group of passengers can be directly invested in climate protection through the examples of myclimate climate protection projects listed, based on the corresponding level of environmental impact.
The flight distance between two airports is based on the great circle distance, which is the shortest distance between two airports. For non-direct flights with a stopover, the stages are treated as individual flights. Since the type of aircraft and the passenger load factors depend on the flight distance, we differentiate between short-haul (<1500 km) and long-haul flights (>2500 km). Since there is no distinct limit for short-haul flights, we interpolate for flight distances in between 1500 and 2500 km to get a smooth transition.
The actual flight distance between two airports is often considerably longer than the shortest distance between two airports. The extra mileage is mainly due to inefficiencies in air traffic control systems, due to storm systems or other weather events as well as holding patterns (waiting loops) before landing (Kettunen 2005). While no reliable global statistics exist on the extra mileage flown, regional estimates amount to 6–8 per cent over the US and 10 per cent over Europe (Kettunen 2005). However, such a relative approach usually leads to overestimations of the extra mileage on long-haul flights. For this reason, the approach suggested by the European standard DIN EN 16258 (2012) is adopted and an extra mileage/distance correction (DC) of 95 km is added for all flights.
To meet the needs of the users of the online flight emission calculator – particularly enabling more specific selection of aircraft type via the categorisation of short-haul and long-haul aircraft –, the most common aircraft types have been added to the flight emission calculator’s 2023 update.
This involved analysis of the largest airlines in Europe and worldwide (AirMundo 2023, Murphy 2023). The fleet size and classification of aircraft types were obtained from information on the airlines’ websites (Ryanair 2023, International Airlines Group Fleet 2023, Air France 2022, Easyjet Fleet 2023, Lufthansa Group Fleet 2023, Delta Airlines Fleet 2023, Southwest Airlines Fleet 2023, United Continental Fleet 2023). Only aircraft currently in service were included. Orders for new aircraft and regional aircraft types (Embraer/Bombardier) were discounted.
According to (Mordor Intelligence Research & Advisory, Wikipedia 2023), all passenger aircraft in service worldwide are represented by the Airbus A320 family (25 %), the Boeing 737 family (25 %), the Airbus A330 family (4 %), the Boeing 777 family (4 %) and the Boeing 787 family (2.5 %). A total of over 60 per cent of flights worldwide are therefore operated by these five aircraft families.
Based on the ten most common aircraft types for short- and long-haul flights analysed above, the flight emission calculator therefore offers a large share of European and global aircraft types for selection.
The fuel consumption per distance is based on fuel burn rates from aircraft used on short-haul (1500 km) and long-haul (>2500 km) flights. Emissions of fuel burnt per aircraft kilometre are based on the EMEP/EEA air pollutant emission inventory guidebook (EEA 2019). In addition, a constant fuel amount is added to each flight in order to account for the consumption of the aircraft during landing and take-off (LTO) as well as during the taxi phase (ground movement on airport) (EEA 2019).
The consumption of the aircraft is based on a weighted average of fuel burn rates and consumption for landing/take-off cycles for the aircraft types used most. The weighting of the aircraft types is derived from the composition of the largest aircraft fleets in Europe and worldwide (see source research in section 3) and is based on data from the largest airlines.
This approach forms the basis for calculating the weighted average fuel consumption for different flight distances. Fuel consumption is calculated for each aircraft type where the aircraft type is specified. A generalised function for the fuel consumption of any flight distance is approximated with a second-order polynomial fit for short-haul and long-haul flights.
f(x) + LT0 = ax2 + bx + c
with x = GCD + DC, where GCD is the great circle distance [km], DC the distance correction [km] for extra mileage and LTO the extra fuel used per landing and take-off cycle. The fuel consumption for distances between 1500 and 2500 km is linearly interpolated.
The online calculator accounts for the CO2 emissions through pre-production of jet fuel/kerosene (including transport and refinery processes) and fuel combustion. The emission factor for the combustion of jet fuel (kerosene) is 3.16 kg CO2e/kg kerosene (mobitool 2023) and the factor for pre-production used here is 0.538 kg CO2e/kg kerosene (mobitool 2023).
Passenger aircraft often transport considerable amounts of freight and mail, in particular in widebody aircraft on long-haul flights. It is therefore necessary to allocate some of the total aircraft emissions to the cargo load. To remain in line with the European standard DIN EN 16258 (2012), cargo transported by air is allocated according to its weight (mass approach). Due to its higher payload (LH 2014) on international flights, emissions from air cargo are considerably higher. The share of emissions attributable to passengers is correspondingly lower.
The cargo factor (CF) is defined as the ratio between cargo weight and payload. The cargo weight is calculated using the possible cargo volume in the hold of the aircraft and the average aircraft load of 167 kg/m³ (de Barra 2022). The average available load volumes, the cargo weight and the maximum payload are taken from the respective Wikipedia entries for the aircraft types (as at: 2023).
The CO2 emissions per aircraft are distributed across the average number of passengers on short-haul and long-haul flights. The number of passengers is here defined as the number of seats per aircraft type (ICAODATA 2019) multiplied by the passenger load factor published by the International Air Transport Association (ICAO 2018). The numbers are calculated for each aircraft type and then weighted according to the weighting scheme described above.
The average seating capacity of aircraft is mainly based on the distribution of cabin classes. First and business cabin classes take up more space and thus do not allow for as many passengers as an aircraft with only economy class seats. This is why the emissions calculator allows you to select the cabin class. The cabin class weighting factor is adopted from the IATA CO2 calculation methodology paper for passengers (IATA 2023) and is applied in correspondence with the specified flight data and aircraft type using the weighting scheme described above.
Aircraft not only emit CO2 but also other forcing agents that affect the Earth’s radiative balance and with it, the climate. Amongst other factors, emissions from aviation also lead to short-term increases in tropospheric ozone as a consequence of nitrogen oxide (NOx) emissions, initiate condensation trails (contrails) and may affect the formation of cirrus clouds. The total radiative effects have therefore been estimated to be two to four times larger than the direct CO2 radiative forcing. However, research is ongoing in order to limit the uncertainties. Furthermore, a comparison of CO2 and non-CO2 effects is particularly challenging as they act on different time scales. Nevertheless, ignoring these effects would not be a far-sighted scientific approach.
Based on correct interpretation of the most recent scientific publications, the latest studies (Lee et al. 2021, scnat 2021) recommend an RFI factor (Radiative Forcing Index: ratio of the impact on the climate of all climate-impacting effects of aviation – known as the non-CO2 effects – to the climate impact of aviation-related CO2 (Allianz 2023)) of 3 for the total aircraft CO2 emissions, if the climate impact approach refers to the time horizon of 30 years that is essential for the net-zero target (2050). This places a disproportionate weighting on the short-term effects of non-CO2 emissions, which is in line with the myclimate guidelines and is thus taken into account when calculating flight emissions. This multiplier has a decisive influence on the level of calculated flight emissions. In the previous versions of the myclimate flight calculator, the RFI factor was set to 2, based on scientific studies.
Aircraft are firstly produced, then maintained and at the end of their life disposed. The emissions related to these activities are included in form of a factor, which allocates the emissions to the total number of kilometres flown. Furthermore, flying requires a certain infrastructure; these emissions from airport operations are also included (Messmer & Frischknecht, 2016).
The following formula is used to calculate the total CO2-equivalent emissions:
with
E: CO2-equivalent emissions per passenger [kg]
x: Flight distance [km], defined as the sum of GCD (great circle distance) and DC (distance correction for detours and holding patterns) and inefficiencies in the air traffic control systems [km]
S: Average number of seats (total across all cabin classes)
PLF: Passenger load factor
CF: Cargo factor
CW: Cabin class weighting factor
EF: CO2 emission factor for jet fuel combustion (kerosene)
M: Multiplier accounting for potential non-CO2 effects
P: CO2e emission factor for pre-production jet fuel, kerosene
AF: Aircraft factor
A: Airport infrastructure emissions
The part ax2 + bx + c is a nonlinear approximation of f(x) + LTO
LTO: Fuel consumption during landing and take-off cycle including taxi [kg] Short-haul is defined as x <1500 km and long-haul as x >2500 km. In between, a linear interpolation is used.
The following parameters are used for the calculation:
|